INCLUDE Linear Regression Tutorial: step-by-step instructions
This tutorial project includes tools for linear regression modeling in R using high-throughput (HTP) research data from the INCLUDE Data Hub, configured for use on the CAVATICA platform. The analysis covers advanced data modeling and visualization in R.
This project builds computational and data science capacity within the INCLUDE Project and the broader Down Syndrome research community. It was inspired by materials from the Data Science for Developing Scholars in Down Syndrome Research (DS3) program, developed by Matthew Galbraith; see the GitHub repository and the associated publication.
To learn more about this project, or how to adapt it to your own research, please reach out to [email protected].
Set up the project and run the R script in Data Studio
To perform the INCLUDE HTP linear regression analysis, you’ll need to make your own copy of the Public Project and then execute the R script in a Data Studio session. Public Projects contain all necessary files, instructions, and tools necessary to perform the specified analysis(es). However, the Public Project serves as a repository for all users, and as such, is not editable.
1. Copy the public project
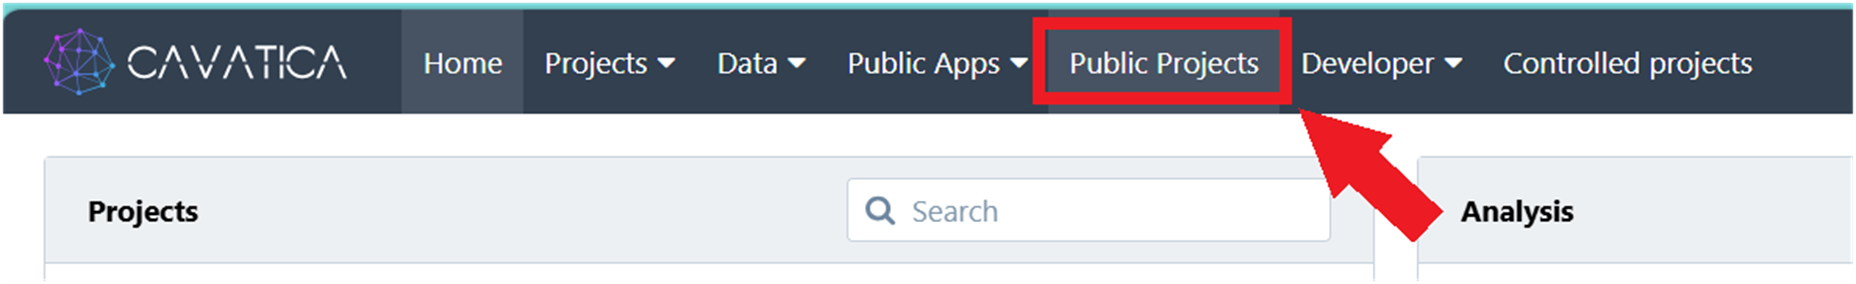
1.1. Click Public Projects on the top navigation bar.
1.2. Click the "INCLUDE HTP Linear Regression Analysis".
1.3. Click the ‘i’ icon next to the public project title, and then click Copy project. The ‘Copy Project’ window will appear.
1.4. Give your project a unique name. 1.5. Under "Billing group", select your pilot funds group. 1.6. Click Copy (bottom right).
2. Set up environment and start RStudio
2.1. Copy the project by clicking the icon next to the project name, and selecting "Copy project".
2.2. Open Data Studio session: Navigate to Data Studio along the top gray banner of your copy of the project and click the purple start icon beside INCLUDE Linear Regression Analysis.
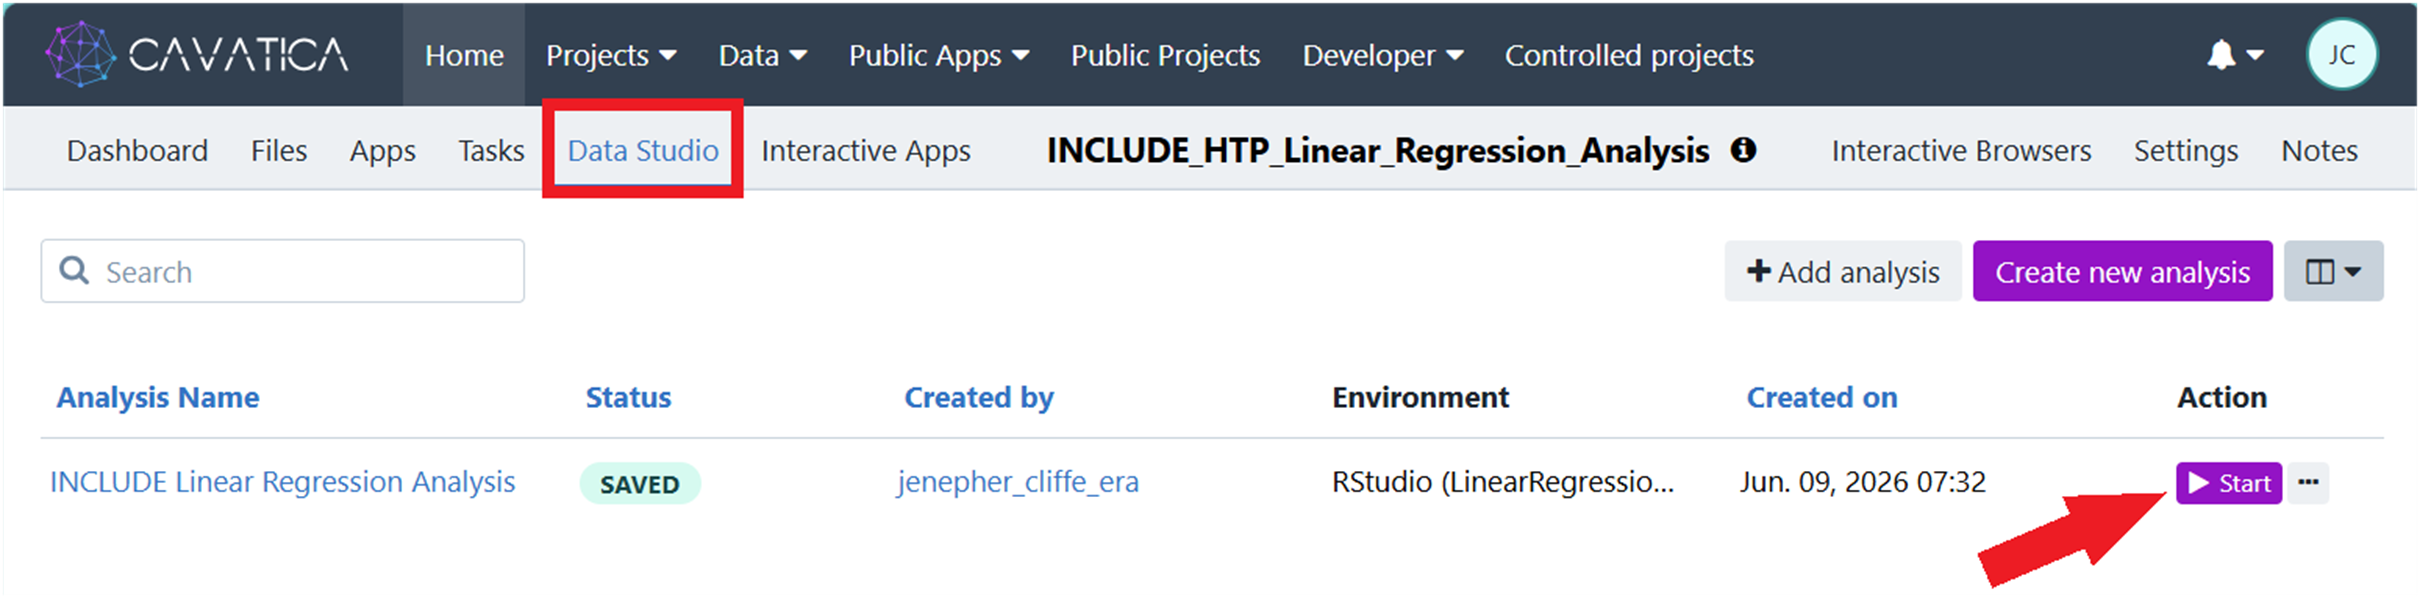
Note that you will have to wait a few minutes while SB initializes the Data Studio virtual machine.
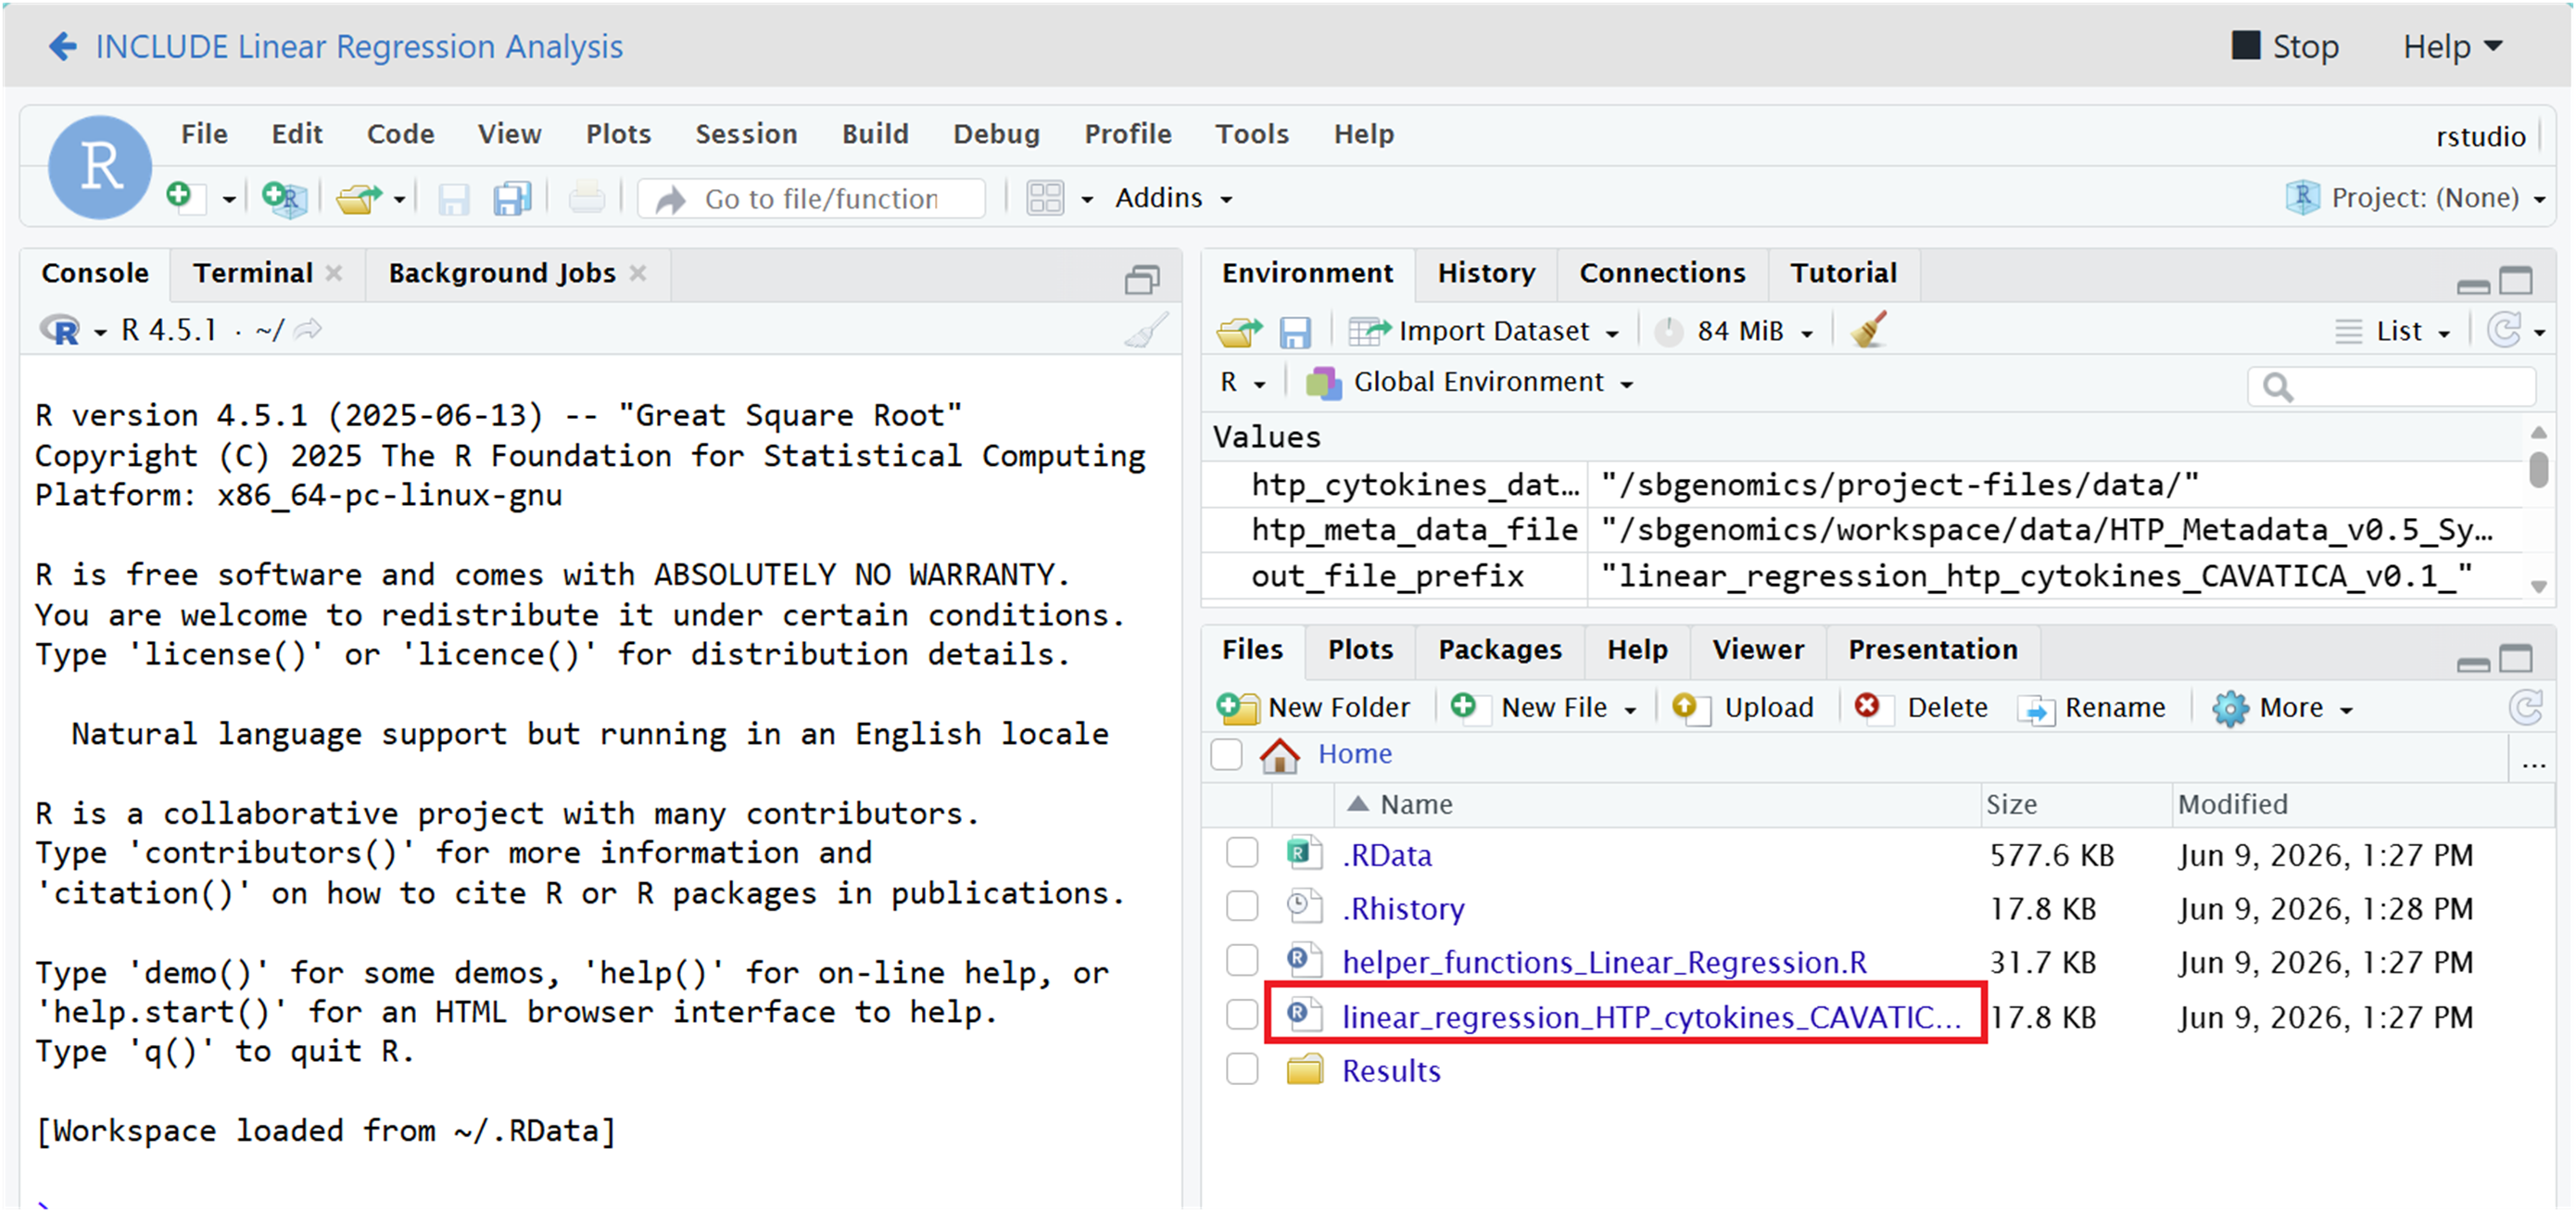
2.3. Open the R script in RStudio by clicking on linear_regression_htp_cytokins_CAVATICA.R in the Files window (lower right pane).
3. Explore the main R Script
3.1. Review and run the analysis step-by-step by clicking the Run icon above the console window.
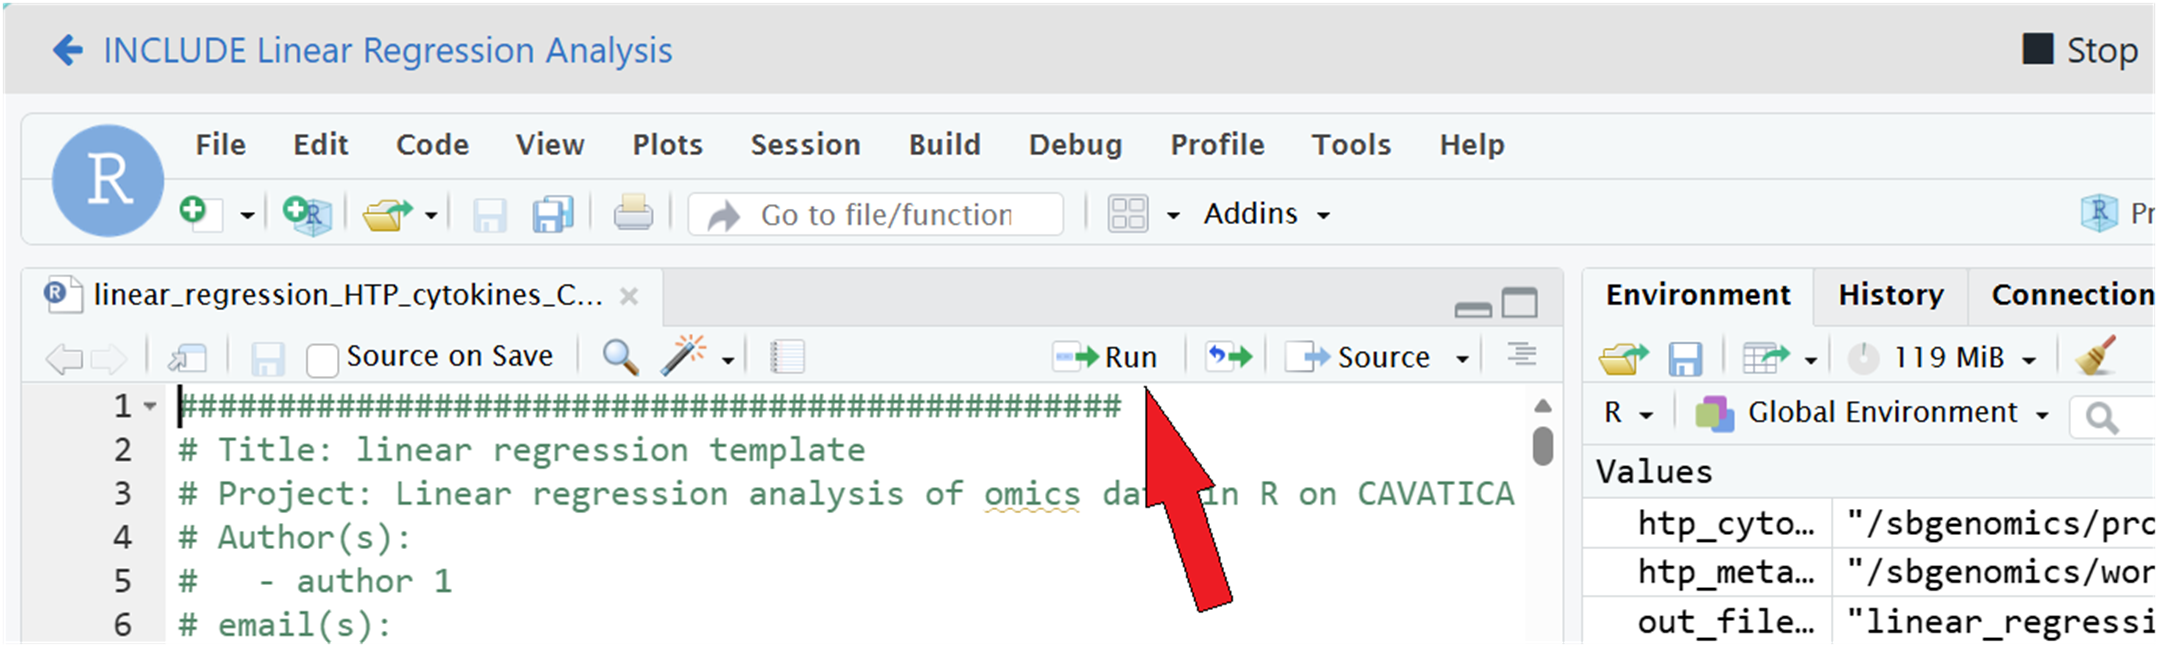
Comments in the code explain each step as you run it.
4. Clean up and close Data Studio
4.1. Clean up cache before stopping the analysis
This ensures a faster save process when stopping your analysis session
Run the following command in the terminal
sudo rm -rf ~/.cache/R/ && rm -rf ~/.local/share/4.2. Stop the analysis once everything is complete.
This will take a few minutes, as SB syncs the files in the /output-files directory to the project Files.
💡Saving outputs to project files
Output files generated during your analysis are stored in the Data Studio environment and are not accessible outside your private DS session. Note that the last part of the R script copies the files from/sbgenomics/workspace/to the/sbgenomics/output-filedirectory, which is automatically synced to the project when you stop the Data Studio analysis.Once the analysis is stopped, these files will be available in the Files tab of the project (along the gray navigation bar).
Customization (advanced resources)
Note that we have included advanced options for customizing the data Studio environment in the “advanced_customization" folder inside the analysis directory.
Updated about 1 month ago