Bulk RNA-Seq Transcription Profiling of HSV-1 Infected Cells
This Public Project serves as an example and provides scaffolding for Bulk RNA-Seq Processing and downstream Differential Expression analysis.
These data were obtained from experiments with Human fibroblast cells either infected or mock-infected with Herpes simplex virus (HSV-1), and are publicly available.
Two groups, 3 of each treatment type, will be analyzed using the Bulk RNA-Seq processing pipeline Tool, starting from raw FASTQ reads and outputting a citable report with summary statistics and key graphs.
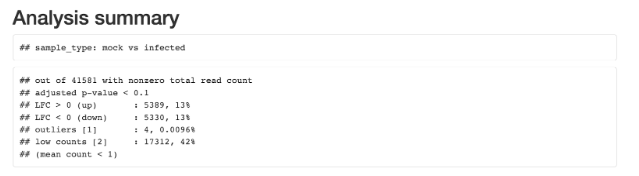
Analysis substeps and total analysis outputs are retained for further exploration and post-hoc testing. The results will show the two groups expressing different Transcriptome profiles for ~25% of genes.
This page contains detailed, step-by-step instructions to follow while carrying out the analysis through the Bulk RNA-Seq Transcription Profiling of HSV-1 Infected Cells.
To learn more about this project, or how to adapt it to your own research, please reach out to [email protected].
Set up the project and run the workflow
To perform the Bulk RNA-Seq analysis, you will first copy the Public Project and then execute the Workflow therein. Public Projects contain all necessary files, instructions, and tools necessary to perform the specified analysis(es).
In order to perform the analysis, you will need to make your own copy; the Public Project serves as a repository for all users, and as such, is not editable.
Copy the public project
- Click Public Projects on the top navigation bar.
- Click "Bulk RNA-Seq Transcription Profiling of Herpes simplex Virus (HSV-1) Infected Cells".

- Click the ‘i’ icon next to the public project title, and then click Copy project. The ‘Copy Project’ window will appear.
- Under "Billing group", select your pilot funds group.
- Click Copy.
Run the Bulk RNA-Seq Workflow
Overview
CAVATICA offers a repository of publicly available Apps suitable for many different types of data processing and analysis.
Apps include both Tools (individual bioinformatics utilities) and Workflows (chains or pipelines of connected tools). Publicly available Apps are maintained by the Seven Bridges bioinformatics team and represent the latest tool versions.
The Workflow will need to be parameterized for the ‘Bulk RNA-Seq sequencing pipeline’ to produce Differential Expression (DE) Transcriptome results.
You will supply the data (human fibroblast cells infected and mock infected with HSV-1) included in the copy of the project, and run the pipeline to produce significant DE results.
Procedure
-
Click the Projects tab on the top navigation bar and click your new copy of Bulk RNA-Seq for HSV-1. The Project Dashboard window will appear.
-
Click the Apps tab.

-
Click ▶︎Run to the right of the Bulk RNA-Seq processing pipeline Workflow. A new window will appear to run the Task (a specific execution of a Workflow or Tool).
-
The next step is selecting input files for the Task:
a. for "FASTQ read files": click Select file(s), select all available FASTQ files and click Save selection.
b. for "GTF annotation file": click Select file(s), select "GRCh38ERCC.ensembl102.gtf" and click Save selection.
c. for “Transcript FASTA or Salmon Index”: click Select file(s), select "GRCh38ERCC.ensembl102.transcriptome.fasta" and click Save selection.
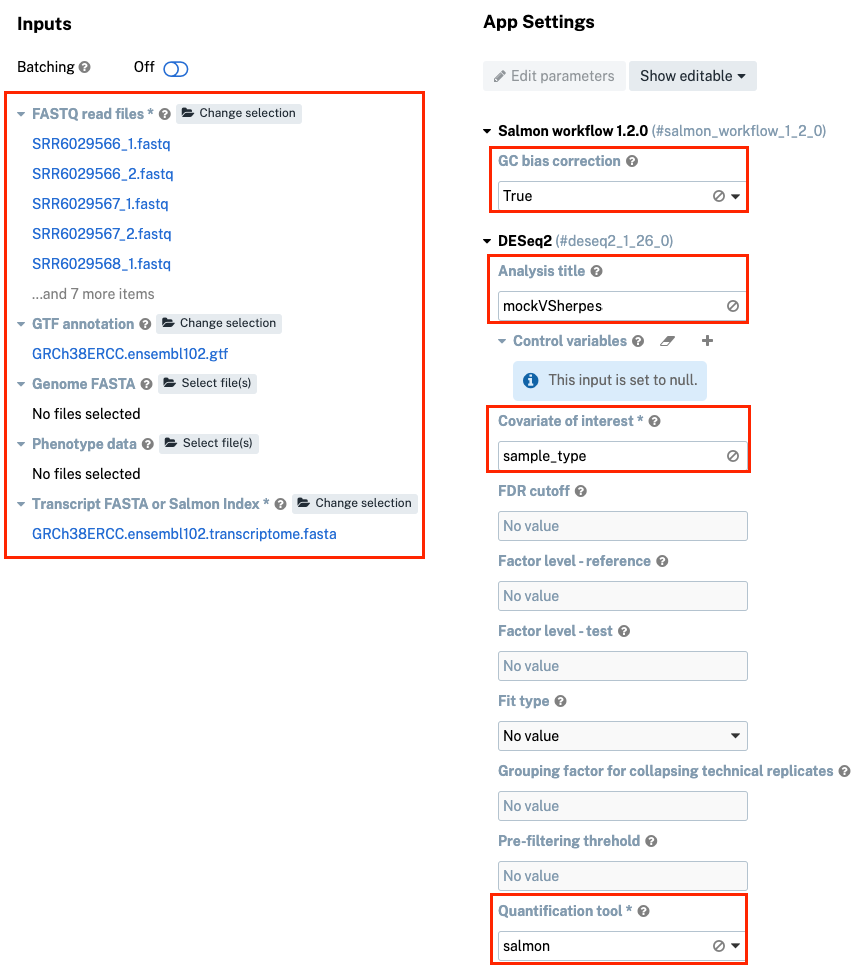
-
Under "App Settings", set "GC Bias correction" parameter to “True.”
-
Populate the "Analysis title" with “mockVSherpes” and "Covariate of interest" with “sample_type”.
-
Navigate further down the page and set "Quantification tool" to “salmon”.
-
Click Run. The Workflow will start processing the data and running analyses.
You can monitor the progress by looking at the status displayed right next to the title of the task. Once the task is completed, you can view the results on the Tasks tab.
Interpret your results
The results will be summarized in the mockVSherpes.deseq2.1.26.0.summary_report.b64html “DESeq2 HTML report” section of the results. Individual results and iterative analyses contributing to the final results are available under the other Output Settings section.
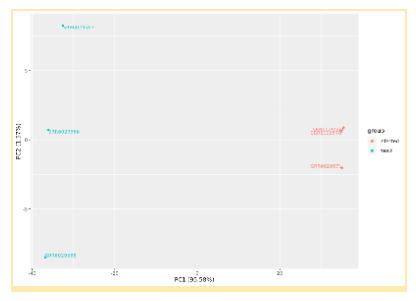
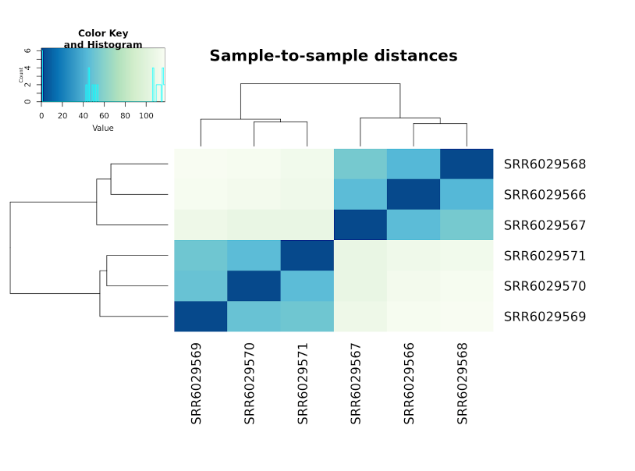
Inspection of the results will reveal Differential Expression of the Transcriptome between infected and mock infected groups. These results are expressed in a number of different ways, including Principal Component Analysis plots, Cluster Dendrograms, and Gene tables.
Updated 9 months ago