View instance metrics
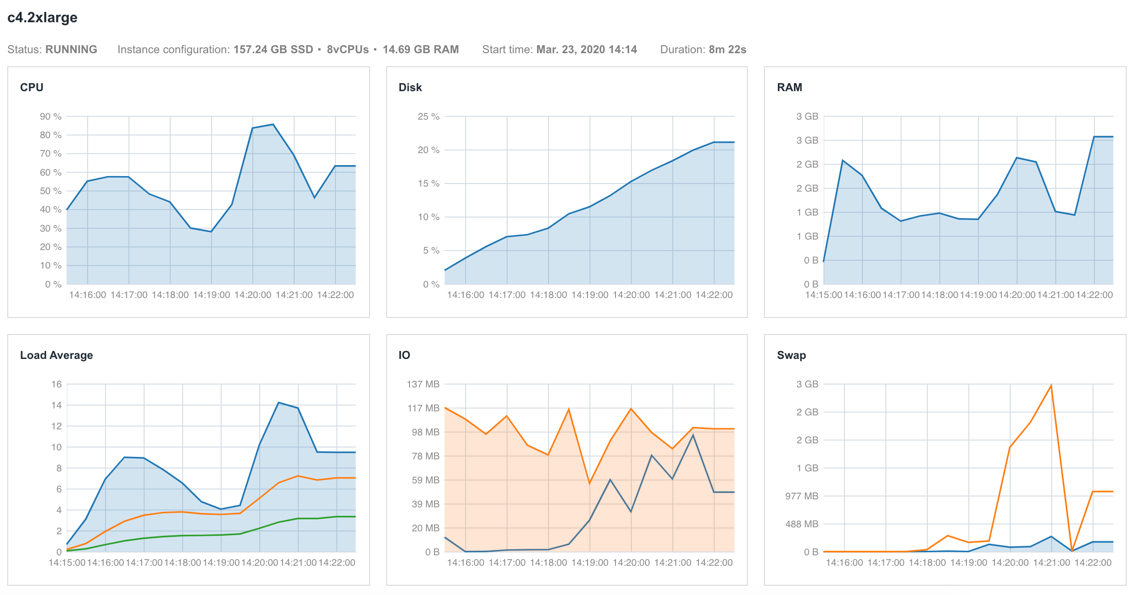
CAVATICA lets you access instance metrics information for all instances used in task execution. The following information is available during task execution and for 15 days after the task has been executed:
- Instance type, purchasing type and status.
- Instance configuration - i.e. available vCPUs, Memory, Disk space.
- CPU usage.
- Disk usage.
- Memory usage.
- Load average.
- I/O activity.
- Swap activity.
As a general rule of thumb for optimal resource utilization, CPU usage should continuously be as high as possible, while RAM and Disk available should be enough to withstand peak loads

To access this information:
- Navigate to the project where the task is being executed.
- Click the Tasks tab. A list of tasks is displayed.
- Click the name of the desired task.
- To open the Task stats page, click View stats & logs.
- Click the Instance Metrics button. You are now taken to the Instance metrics view.
Updated 6 months ago
