Advanced practices
Annotate output files with metadata
You may want to annotate the files produced by a tool with metadata, which will then be used by other tools in a workflow. You can choose the the name and type of these metadata by defining your own key-value pairs. Any keys can be used, but see this list for commonly used file metadata.
Annotate output files with metadata in CWL v1.0 apps
To enter key-value pairs that will be added to output files as metadata:
- In the Output Ports section click the port for which you want to set metadata.
- In the object inspector on the right, under Metadata, select the input port from which you would like to inherit metadata and use it to annotate files produced on the given output port.
The Output eval field gets automatically populated with an expression. - Click the Output eval field. The Expression Editor opens, showing an expression such as
$(inheritMetadata(self, inputs.bam)). This is expected and means that the files produced on the output port you are editing will inherit metadata from the input port whose ID is bam.
To annotate output file(s) with a custom metadata key and value pair (one not present on the input port), edit the expression in the Output eval field as follows:
${
    var out = inheritMetadata(self, inputs.<input_id>)
    out.metadata['new_key'] = 'new_value'
    return out
}
In the expression, <input_id> is the ID of the input port from which you are inheriting metadata, which was bam in the example above. The line out.metadata['new_key'] = 'new_value' sets a new, custom metadata key-value pair and can be repeated with new key values to set additional custom metadata.
Annotate output files with metadata in CWL sbg:draft-2 apps
To enter key-value pairs that will be added to output files as metadata, click on any output port that you have in the Output Ports section. In the object inspector, under Metadata, click + Add Metadata. There is a field for the metadata Keys and a field for the corresponding Value.
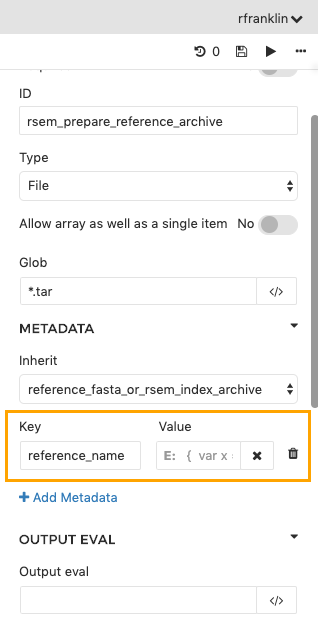
Using dynamic expressions to capture metadataMetadata values can be string literals or dynamic expressions. For instance, the
$selfobject can be used to refer to the path of the file being outputted. See the documentation on dynamic expressions in tool descriptions for more details.
Create custom input structures for tools
Certain tools will require more complex data types as inputs than simply files, strings or similar simple types. In particular, you may need to input arrays of structures. This requires you to define a custom input structure that is essentially an input type that is composed of further input types. A common situation in which you'll need to use a complex data structure is when the input to your bioinformatics tool is a genomic sample. This will consist of, for example, a BAM file and a sample ID (string), or perhaps two FASTQ files and an insert size (int).
To define a custom input structure:
- In the Input Ports section of the tool editor select an input port or add a new one by clicking Add an Input.
- Edit the ID of your input. In the example shown below we have given the array the ID Custom_input. You can give it any ID you choose.
- In the object inspector on the right, in the Type drop-down list select array.
- In the Items Type drop-down select record to define your own types.
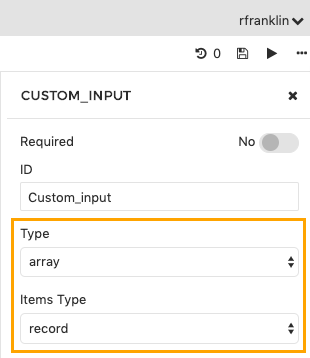
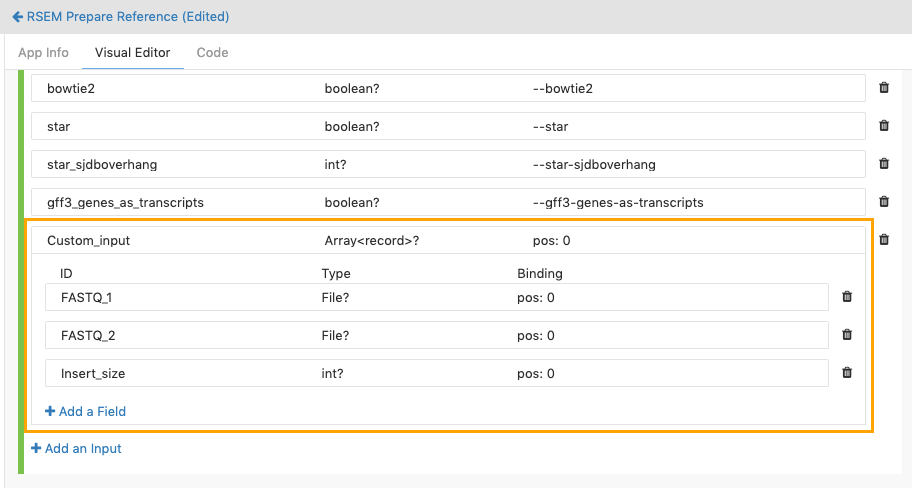
Once you have created the input array, you can define its fields. To do this, in the Input Ports section click the Add field button within the newly created input.

Define the individual input fields that the array is composed of. You define the input fields of an input array in the same way as you would usually define an input port for a tool. In our example, let's set the array data structure to take three inputs, two of which are FASTQ files, and the third of which is the insert size. We'll label the input ports with the IDs FASTQ_1, FASTQ_2 and Insert_size, respectively. We set the Type of the first two to File, and the Type of the third as int.
Describe index files
Some tools generate index files, such as .bai, .tbx, .bwt files. Typically, you will want CAVATICA to treat indexes as attached to their associated data file, so that they will be copied and moved along with the data file in workflows. To represent the index file as attached to its data file you should make sure that:
- The index file has the same filename as the data file and is stored in the same directory as it.
- You have indicated in the tool editor that an index file is expected to be output alongside the data file.
To do this:
- In the Output Ports section of the editor, enter the details of the data file as the output.
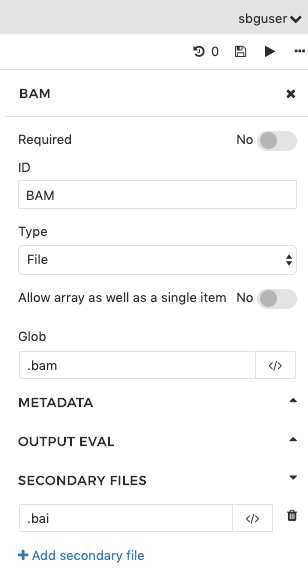
- Under Secondary Files click Add secondary file and enter the extension of the index file, modified according to the following convention (suppose that the index file has extension '.ext'):
- If the index file is named by simply appending .ext onto the end of the extension of the data file, then simply enter .ext in the field. For example, do this if the data file is a .bam and the index extension is .bai (so the resulting file name of the index file is file_name.bam.bai).
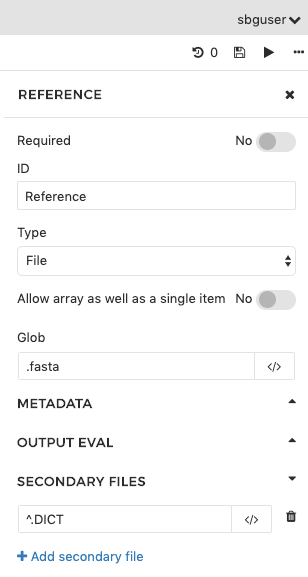
- If the index file is named by replacing the extension of the data file with .ext, then enter ^.ext in the the field. For example, when the data file is a FASTA contig list and the index extension is .dict.
In the first example, we have named the output port 'BAM' and set up globbing to catch all files with the .bam extension and designate them as its outputs. We have also specified that a secondary file is expected, and that it should have the same name as the BAM file, but with the .bai extension appended to the file name and extension of the BAM file.
In the second example, the output port is named Reference and it catches files with the .fasta extension. We have specified that an index file is expected, and that it will have the same file name as the FASTA file but that the .DICT extension will replace the extension of the FASTA file.
Attaching index files and data files
Some tools (indexers) only output index files for inputted data files; they do not output the data file and the index together. If your tool is one of these, then the index file will be outputted to the current working directory of the job, but the data file will not. This can make it difficult to forward the data file and index file together.
In this case, if you need to forward an input file with an attached index file, then you should copy the data file to the current working directory of the job (tool execution), since this is the directory to which the index file will be outputted. To copy the data file to the current working directory, select Copy under Stage Input on the description of that input port (CWL version sbg:draft-2 only).
Describe index files using expressions (CWL v1.x)
CWL version 1.x also supports expressions as a method of defining index file extensions. This allows you to implement a more complex logic, such as:
${
    if (self.nameext == '.gz'){
        return {'class': 'File', 'path': self.path + '.tbi'}
    }
    else{
        return {'class': 'File', 'path': self.path + '.idx'}
    }
}
In the expression above, the index file extension depends on the extension of the input file. Specifically, if the extension of the input file is .gz, the returned value is a file object that has the same path as the input file, with the added .tbi extension. Otherwise, the returned file object will have the .idx extension.
Please note that an expression used for describing secondary (index) files can't return a pattern (such as .tbi), but must return a File object with full path to the index file, as shown in the example above.
Import your own CWL tool description
As an alternative to using the integrated editor on CAVATICA, you can add your own tool description in JSON or YAML format, provided that the description is compliant with the Common Workflow Language. This method is useful if you already have CWL files for your tools.
To add your own tool description:
- Click on the Code tab in the tool editor.
- Paste your CWL description, replacing the existing code.
- Click the Save icon in the top-right corner.
Alternatively, you can use the API to upload CWL descriptions of your tools or workflows in JSON or YAML format.
To get started writing CWL by hand, see this guide. Alternatively, try inspecting the CWL descriptions of public apps by opening them in the tool editor and switching to the Code tab.
Configure log files for your tool
Logs are produced and kept for each job executed on CAVATICA. They are shown on the visual interface and via the API:
- To access a job's logs on the visual interface of CAVATICA, go to the view task logs page.
- To access a job's logs via the API, issue the API request to get task execution details.
You can modify the default behavior so that further files are also presented as the logs for a given tool. This is done using a 'hint' specifying the filename or file extension that a file must match in order to be named as a log:
- Open your tool in the tool editor.
- Scroll down to the Hints section.
- Click Add a Hint to add a new hint, consisting of a key-value pair. To configure the log files for your tool, enter
sbg:SaveLogsas the key, and a glob (pattern) as the value. Any filenames matching the glob will be reported as log files for jobs run using the tool. For example, the*.txtglob will match all files in the working directory of the job whose extension is.txt. For more information and examples, see the documentation on globbing. You can also enter a literal filename, such asresults.txtto catch this file specifically.
You can add values (globs) for as many log files as you like. A glob will only match files from the working directory of the job, without recursively searching through any subdirectories.
Differences between the API and visual interfaceNote that the files shown as logs differ depending on whether you are viewing the logs of a job via the visual interface or via the API.
- By default, the view task logs page on the visual interface shows as logs any *.log files in the working directory of the job (including std.err.log and cmd.log) as well as job.json and cwl.output.json files.
- By default, the API request to get task execution details shows as the log only the standard error for the job, std.err.log.
Consequently, if you set the value of
sbg:SaveLogsto*.log, then this will change the files displayed as logs via the API, but will not alter the files shown as logs on the visual interface, since the visual interface already presented all .log files as logs. However, if you add a new value of*.txtforsbg:SaveLogs, then .txt files will be added to the log files shown via the visual interface and the API.
Updated 5 months ago
