Genome Browser
Introduction
The Seven Bridges Genome Browser is our in-house cloud-based genome browser for collaborative work on CAVATICA.
The Genome Browser allows you to:
- Visualize alignment files
- Check coverage and mismatch proportion at base level
- Assess alignments and variants for quality control
- Visualize SNV/Indels and compare these to a supported reference
- Visualize annotation tracks to interpret your data
- Annotate your own data privately, and share comments on data with your collaborators
Visualizing BAM files with the Genome Browser
Any indexed BAM file either produced by or uploaded to CAVATICA can be visualized in the Genome Browser. For convenience all indexed BAM files are marked with the icon (see below).
Only indexed BAM files can be visualized using the Genome Browser. If you try to open a non-indexed file in the Browser, you will receive a warning message.
Visualizing a single BAM file with the Genome Browser
To view an indexed BAM file with the Genome Browser, click on it and the alignment will be displayed on the resulting page, underneath the file details.
Visualizing multiple BAM files with the Genome Browser
In addition to visualizing a single BAM file, the Genome Browser also allows loading of multiple BAM files for easy comparison.
The multi-track Genome Browser can be reached by clicking the Interactive Browsers tab in the upper right corner of the project dashboard.

There are two ways in which you can load multiple BAM files into a session:
Accessing view the File Browser
- Go to the files tab in your project.
- Select desired BAM files.
- Click Open In Interactive Analysis on the upper right corner.
You will be redirected to the Interactive Browsers tab displaying your selected files in BAM tracks.

Accessing via the Interactive Browsers Tab
To access Genome Browser via the "Interactive Browsers" tab:
- Open your project.
- Click the Interactive Browsers tab in the upper right corner. The "Public Interactive browsers" page is displayed.

- On the Genome Browser card click Open.
- Click Add files.

- Select the BAM files that you want to analyze using the file picker.
- Click Add files.

##Visualizing BAM files with IGV or third party tools
If you prefer not to use the Genome Browser, you can also visualize indexed BAM files outputted by your workflow with the Integrative Genomics Viewer (IGV), or any other third party genome browser that supports https access, such as Genome Browse from Golden Helix, that you have installed on your local machine.
To visualize a BAM file with IGV:
- Click the BAM file name to open it.
- Click the ellipsis menu in the top right corner and choose Get download links.
- Copy the URL and paste it into IGV or any other third party tool.
Repeat this procedure for the accompanying BAI file.
Using the Genome Browser
Below you can find an overview of the toolbar and tracks featured in the Genome Browser, and details of the Browser's functionalities.
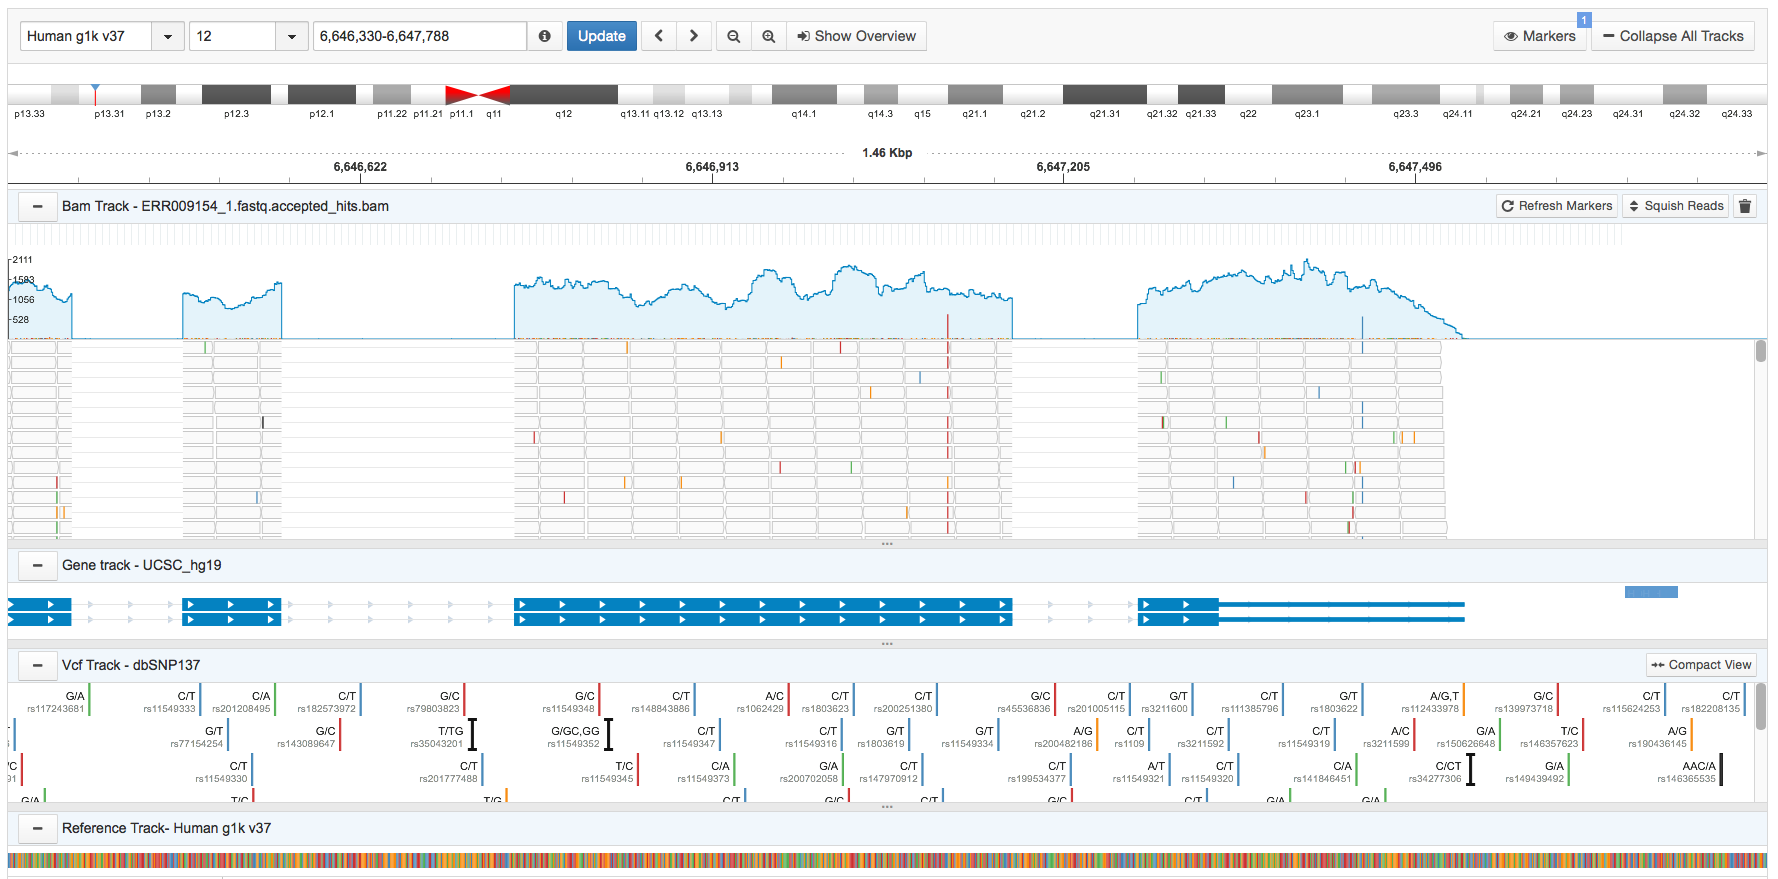
The Seven Bridges Browser
Navigation toolbar
The navigation toolbar at the top of the Genome Browser enables you to easily locate genomic regions.

Navigation Toolbar
There are three fields in the navigation toolbar to pin down genomic regions: the reference genome, chromosome number, and start-end position (shown above).
- The reference genome field lets you choose one of the following: Human hg38, Human GRCh38, Human g1k v37, Human hg19 and Mouse mm10. The hg38 reference is selected by default but can be changed using the drop down menu.
- The chromosome number field lets you choose a chromosome to visualize from the drop-down menu.
- The start-end position field lets you chose a region of the genome by start and end positions. Equally, if you click on a region of the reference genome, this field will display its start-end position.
- The start-end position field doubles as a general search bar. You can search by any of the following: gene name; gene position; startposition-endposition; chromosome:startposition-endposition; and chromosome:position.
For example:Suppose you want to view the gene GAPDH on the Genome Browser. To find it, enter either of the following to the start-end position field:
- Gene name (i.e. GAPDH)
- Position (i.e. 6,644,409)
- Startposition-Endposition (i.e. 6,644,409-6,647,537)
- Chromosome:Startposition-Endposition (i.e. 12:6,644,409-6,647,537 )
- Chromosome:Position (i.e. 12:6,644,409)
If the reference genome is incorrect your BAM will display a large number of false mismatches. Be sure to select the correct reference for your BAM file using the drop-down menu.
If you are entering position or startposition:endposition as your search query you also need to specify the chromosome.
Navigation buttons
- Use the right and left arrows to view consecutive regions of a fixed width along the genome.
- Use the zoom icons to change your view of a given location.
- Use Hide Overview and Show Overview to switch between a track-based view of individual chromosomes and a birds-eye overview of the whole genome.
Navigation Buttons
- Click - Collapse All Tracks to collapse and + Expand All Tracks to expand them.
Collapsing all tracks together can make it easier to rearrange them by drag-and-drop.
Collapse All Tracks
Genome bar
The genome bar or chromosome ideogram provides a graphical overview of a single chromosome. It also features chromosomal bands (shown as gray boxes), the position of the centromere (red triangles), and an indication of the region currently displayed in the ruler track (the red bar).

Bar
- To navigate to a different part of the chromosome, drag-and-drop the red bar.
- To switch chromosomes, just use the ‘chromosome’ drop down list or search bar.
The ruler located below the chromosome ideogram shows the scale of the current view. To zoom in, click and drag a region on the ruler.

Ruler
Tracks on the Genome Browser
The Genome Browser supports four tracks: the BAM track, gene track, VCF track, and the reference track.
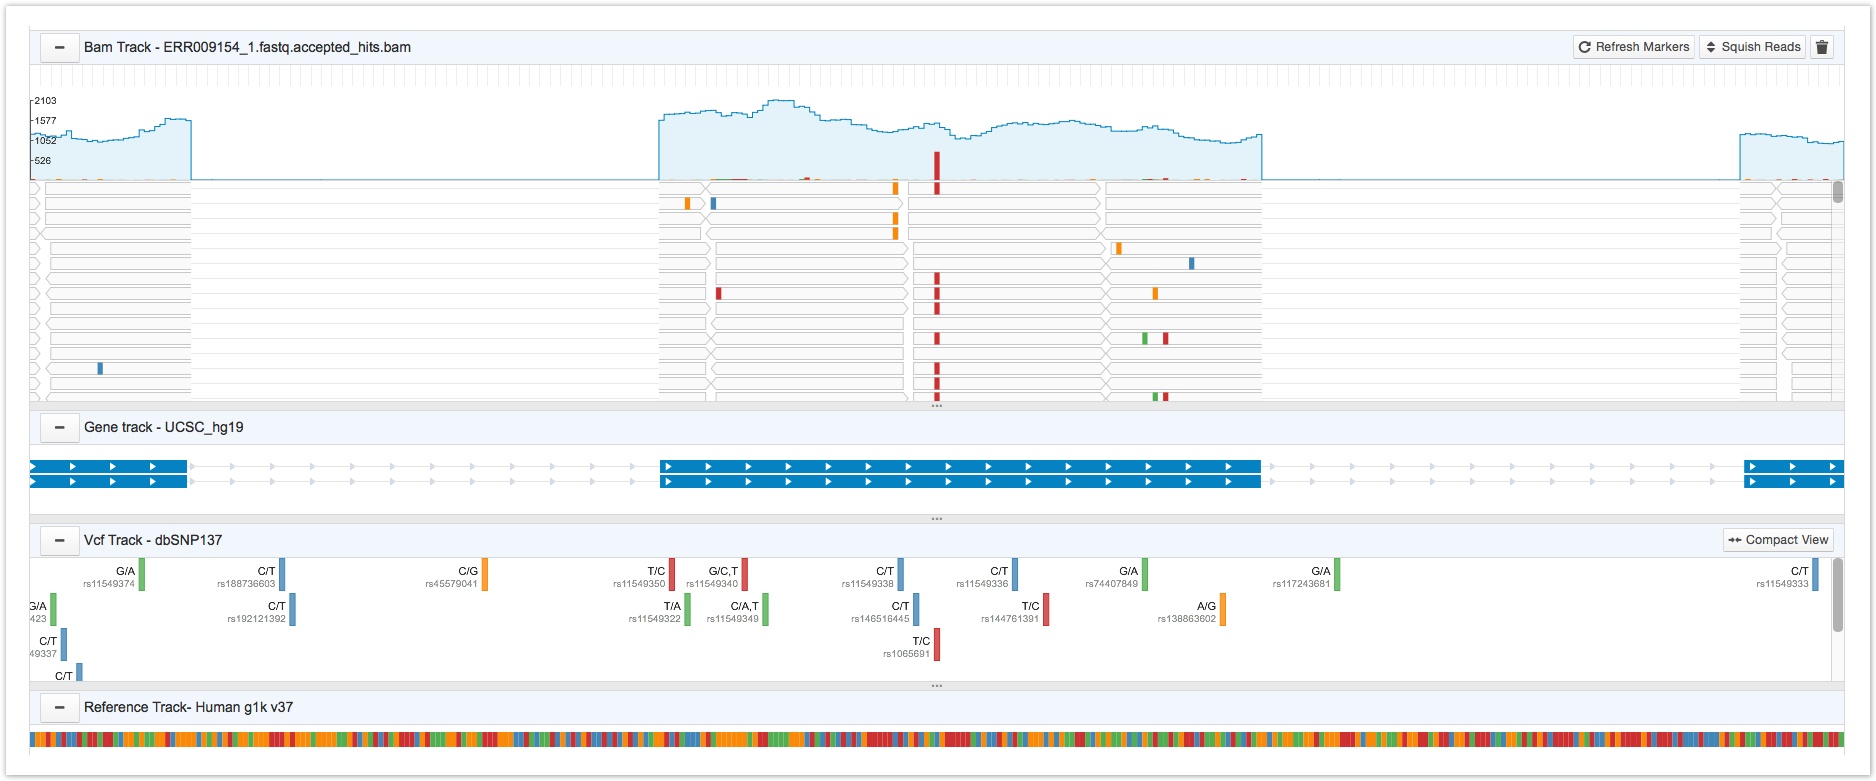
Seven Bridges Browser track
The BAM track
The BAM track displays the alignment data from a single BAM file. It features an overall read coverage panel, which displays the total number of reads for each nucleotide. This is the blue line shown below.
Nucleotides on the BAM file that are different from the reference nucleotide in the corresponding position are shown by colored bars on the read coverage panel. The height of the colored bars indicates the mismatch proportion. Clicking on a particular nucleotide displays a tooltip providing information on a nucleotide's total coverage (depth), its specific location, the reference nucleotide (shown in parentheses), and counts for each type of nucleotide.
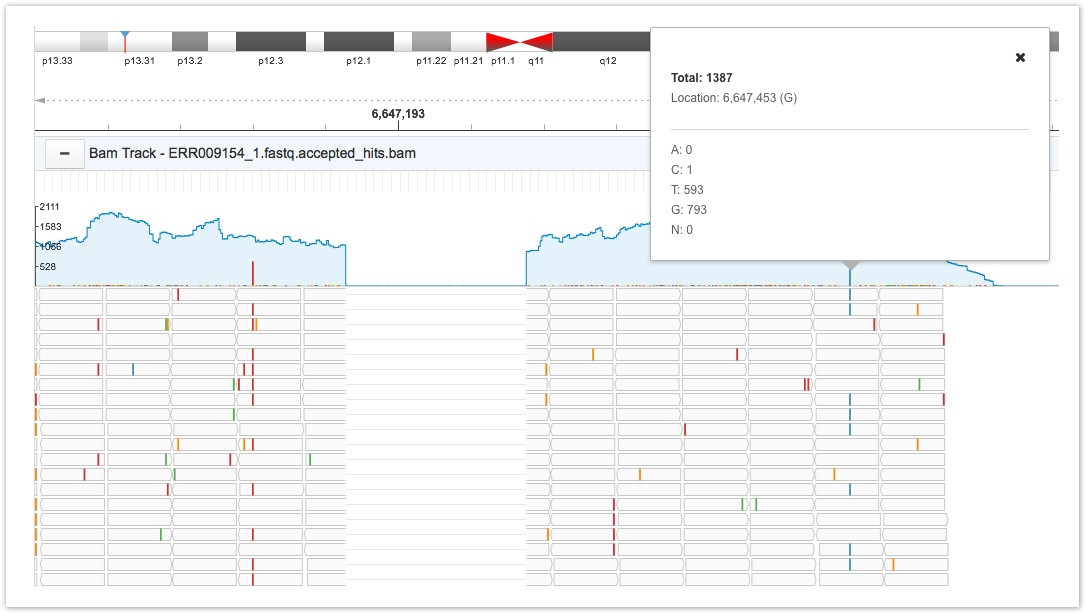
BAM track
Mismatched nucleotides are color coded for easy recognition.
Below the read coverage panel, each individual read is shown separately. The reads are shown as gray bars in the image below. Clicking on a particular nucleotide on a read brings up a tooltip with information on the filename, the reads level information, and flag information. This tooltip also lets you add a marker to the nucleotide; for more details on markers see Collaborating in the Genome Browser.
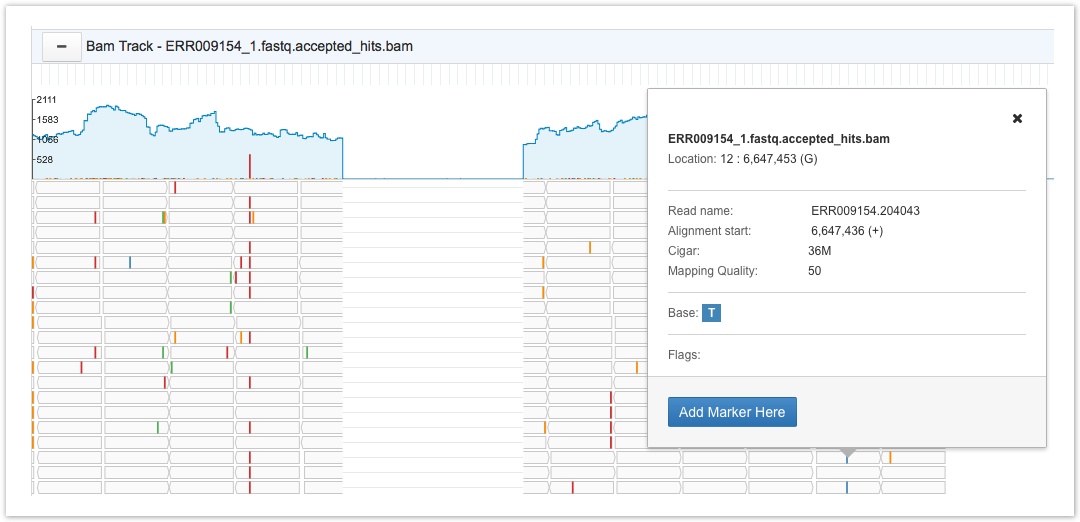
BAM track
You may need to zoom in to the BAM track to see the coverage and to visualize variants at the nucleotide level.
The BAM track has two display modes, full detail and compact. In full detail mode, reads are spaced, allowing easy observation of each read. In compact mode the reads are packed together tightly so that more information can be observed when the read depth is high, as in the image below. Click Squish Reads on the upper right corner of the BAM track to change between the two display modes.
The gene track
The gene track, shown below, displays the known transcripts of every gene. Strand directions are displayed as arrows, UTRs are represented by narrow blue triangles, exons are represented by thicker blue rectangles and introns are displayed as grey lines.

The Gene Track
Click on a transcript on the gene track to see the a tooltip including basic information for transcript name, strand, CDS start and end locations and number of exons. To see further details from the NCBI site on each gene, follow the link on the transcript.
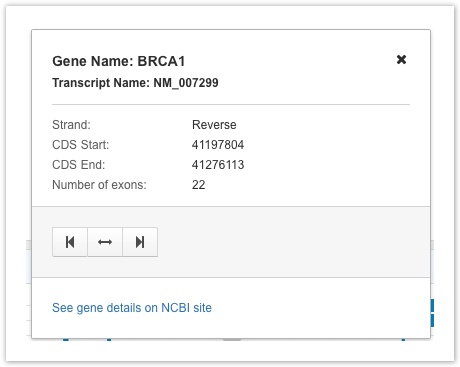
Gene Track Tooltip
The VCF track
The Seven Bridges Genome Browser provides dbSNP147 as a variant call format (VCF) track, shown below. If you are using a reference genome not supported by the Platform, the VCF track will be hidden. The control button located on the upper right side of the VCF track toolbar enables you to switch between the two display modes, detailed view and compact view. In the default, detailed view, you can see both reference/alternative information and rs ID number, together with colored segments representing the alternative variants type. In the compact view, all text information is hidden. Note that the track data is only visible under a certain zoomed-in threshold.
Click on a variant of interest to open a tooltip showing the reference SNP identifier (refSNP id), build version, reference base(s) (REF), alternate base(s) (ALT), variants class (VC), global minor allele frequency (GMAF), VP, strand and position (RSPOS), and a link to the NCBI site.
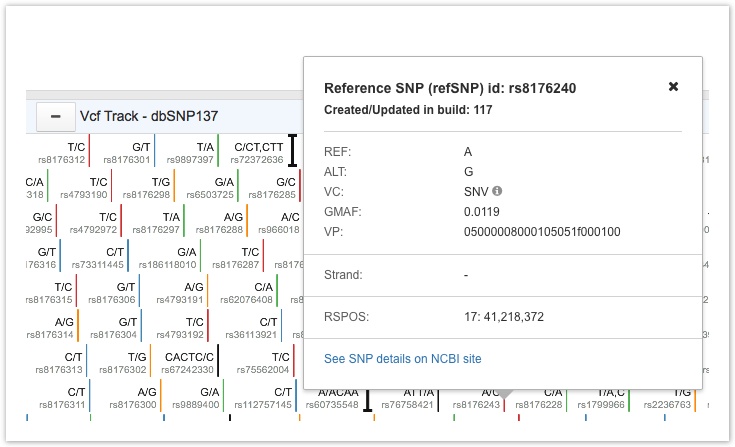
VCF Track Tooltip
When the VCF track is zoomed-out to between 250Kbp and 10Mbp, the display switches to density view in a gray color scale.

VCF Track Zoom
The reference track
The reference track displays a sequence of colour-coded nucleotides. Thymine is indicated in blue, cytosine in red, guanine in yellow, and adenine in green. You can either view the sequence as labeled by nucleotide or by color only.
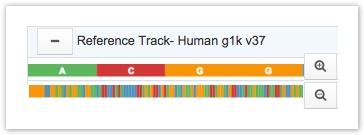
Reference Track
- To resize tracks by hovering your pointer over the panning bar between tracks. The cursor changes to a vertical bi-directional arrow that allows you to resize the track.
- Reorder tracks by dragging and dropping tracks. The cursor changes to a four-directional arrow that allows you to reorder the tracks.
- If you have a large number of tracks, we recommend first collapsing all tracks using the button in the toolbar before attempting to reorder.
Collaborating with the Genome Browser
The Genome Browser allows you to annotate your own data privately by placing markers along the BAM track. You can also share annotations with your collaborators, who can add comments, enabling focussed discussions around points of interest.
To add markers to your data:
- Click on a nucleotide of interest on the BAM track to open the tooltip pop-up window.
- Click Add Marker Here on the tooltip pop-up window to automatically record the marker.
- To add a title and description to your annotation, click the marker which is indicated by a dotted blue line with a padlock symbol.
- To make your marker readable by your project members, check the box marked public on the marker. Public markers are visible to all your collaborators in the project.
You can only add a marker to a single base position.
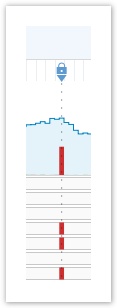
Setting Markers
You can add both hashtags and comments to markers to allow easy collaboration.
- To tag your annotation with a hashtag, enter a descriptive keyword preceded by the symbol ‘#’ in the Description field of the marker. Keywords entered as hashtags are searchable via the search box. So, giving your markers hashtags makes it easier for you and our collaborators to locate them on the BAM track.
- To start a conversation with your collaborators around a particular marker, click Add comment on the marker tooltip. Markers that you have created are shown with a blue triangle, and markers shared with you by your collaborators are shown with black triangles.
To see all your markers, click Markers on the top right corner of the toolbar, shown below.
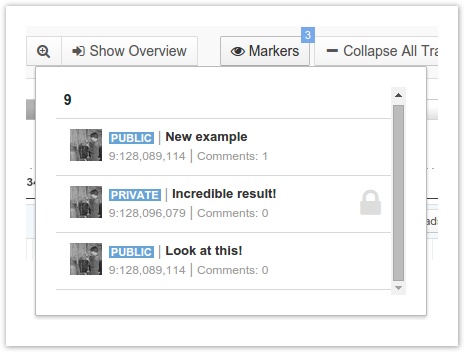
Markers
Updated 3 months ago
